Read the markets like a pro. Trade with confidence.
StockBarChart gives you real-time candlestick charts, Fibonacci retracement, dozens of technical indicators, and email price alerts — all in your browser, no installs.
Everything you need to analyze a chart
From candlestick basics to Fibonacci retracement and multi-timeframe pivot points — all the tools, none of the noise.
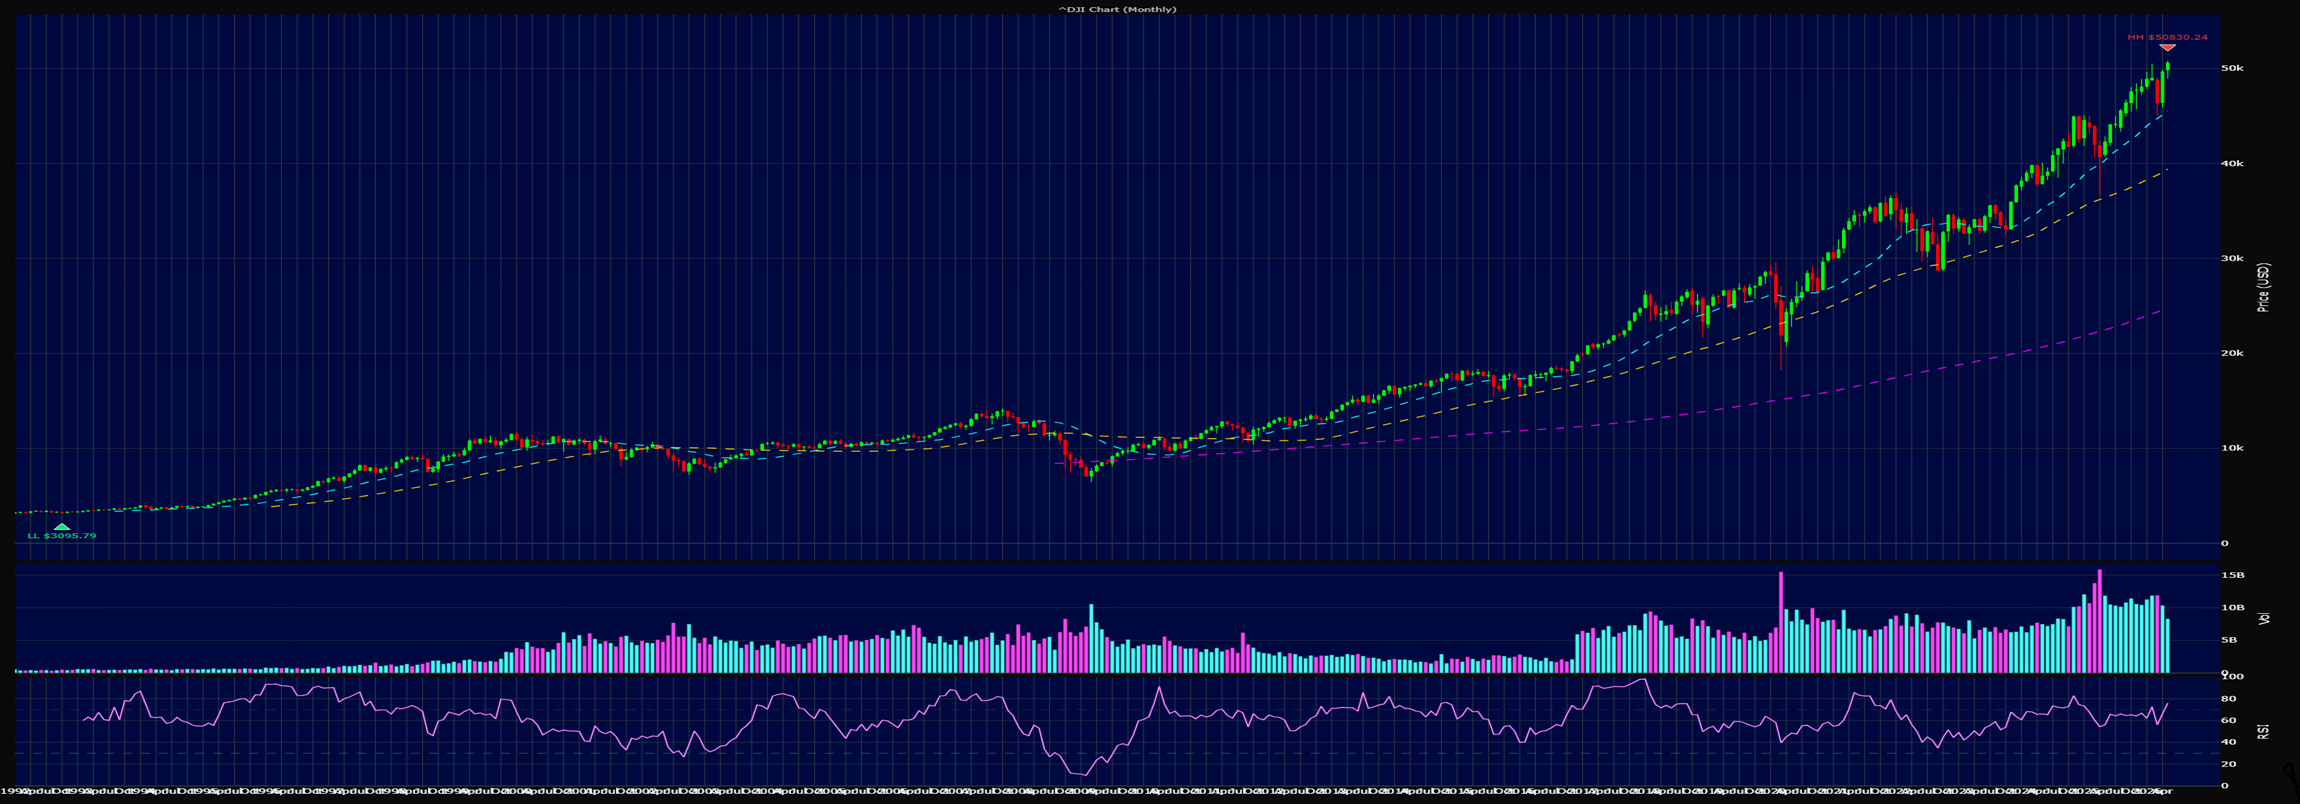
Candlestick & OHLC charts
Real-time bars from minutes to monthlies. Switch between candles, OHLC, or line view with one click — same data, your choice of skin.
Fibonacci retracement
Two-click draw with forward & reverse level lists. Auto-detects uptrend vs downtrend from your drag direction. Lines persist per ticker.
Technical indicators
RSI, MACD, Stochastic, ZigZag, plus five built-in SMA periods and three custom ones — all rendered on one synchronized chart.
Drawing tools
Trend lines, rectangles, circles, freeform paths. Editable endpoints, per-ticker persistence, and TradingView-style left/right line extension.
Multi-timeframe pivot points
Classical floor-trader pivots computed across daily, weekly, and monthly bases simultaneously — see resistance and support at every scale.
Smart auto-refresh
Configurable refresh interval that preserves your exact zoom and drawings across every tick. The chart never jumps under your cursor.
Price alerts via email
Set a level for any ticker and we'll email you the moment it's breached. Alerts auto-deactivate on first fire so your inbox stays clean.
Watchlists, public & private
Your personal watchlist plus a community-curated public list, both with live price refresh and color-coded change indicators.
Live trader chat
Talk to other traders in real time — share signals, ask about setups, post charts. Admins can broadcast market-wide notices instantly.
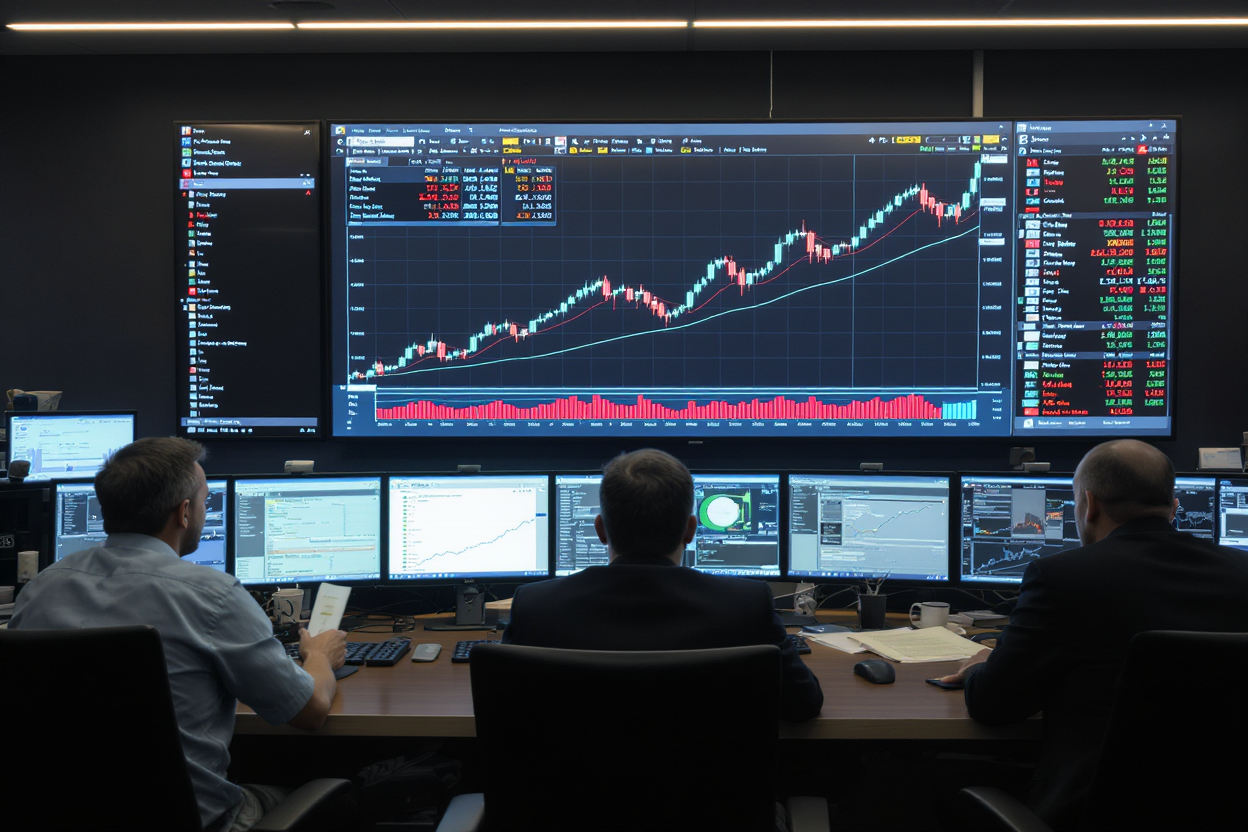
Inside the trading floor
A look at the kind of professional setups our platform is built to support — multi-monitor, multi-asset, multi-timeframe.
Real-Time Analysis
Watch live candlestick formations and technical indicators update tick-by-tick.

Multi-Screen Workflow
Powerful dashboards designed for traders who need to see it all at a glance.

Global Market Coverage
Equities, forex, commodities and crypto — across every major exchange worldwide.
From sign-up to first chart in 3 steps
No installs, no plug-ins, no rate-limited API keys. Open a browser tab and you're ready to analyze.
Sign up free
Create an account with just an email and password. Optional display name for the trader chat. No credit card required.
Pick a ticker
Type any ticker — stock, ETF, futures, crypto. Choose your period (1 month up to max history) and interval (1-minute up to monthly).
Analyze & alert
Layer on indicators, draw Fibonacci levels and trend lines, save them to your watchlist, and set email alerts on key price levels.
Coming Soon!
Account registration will be available shortly. Stay tuned!